Skip to content
Learn:
- What geocoding is
- How to use the Photon geocoding service
1

2
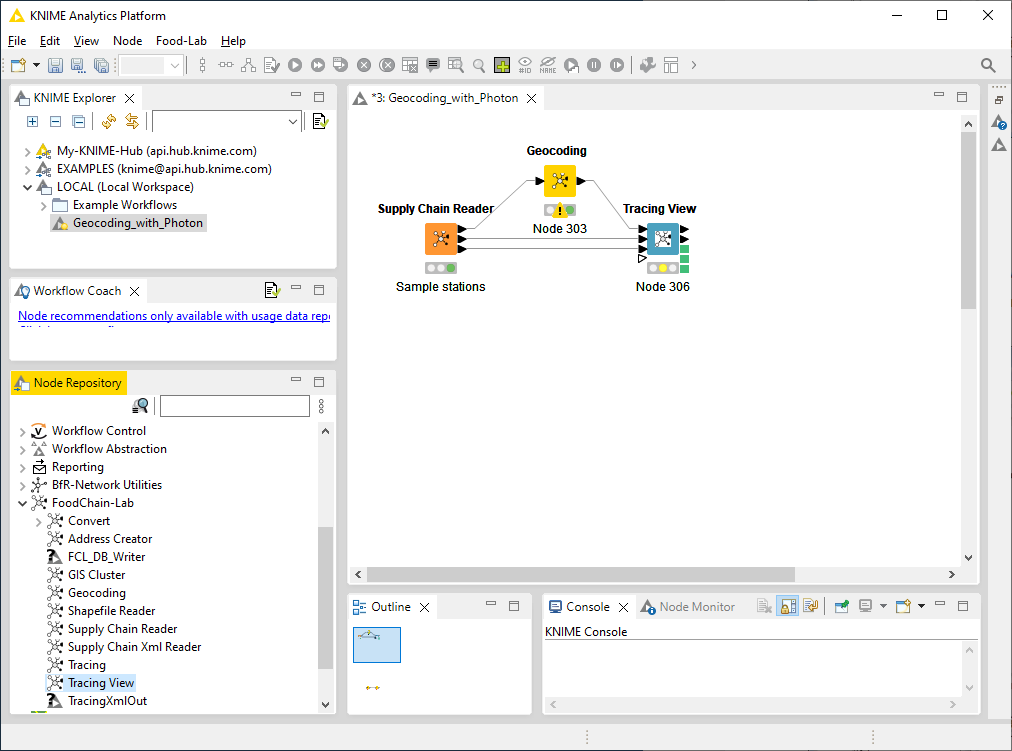
- To perform geocoding we need to add the Geocoding node. If the Supply Chain Reader is selected, double-click on the Geocoding node in the Node Repository.
- Another way to attach the Geocoding node to the Supply Chain Reader is to drag it from the Node Repository into the workflow editor and to connect the top output port of the Supply Chain Reader with the input port of the Geocoding node.

3
- The Geocoding node is connected to the SupplyChainReader and needs to be set up. Open its configuration by double clicking on it or by using its context menu (right click on the node, then choose configure).

4
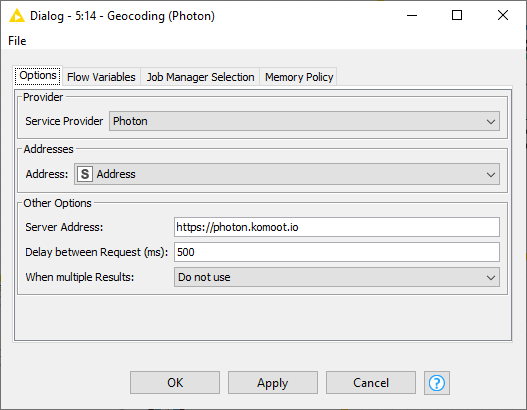
- Please choose the service provider “Photon”.

5
- For this tutorial the column “Address” is needed, which contains street names, house numbers, postal codes and cities. This column is set automatically, but another column could be selected if necessary (for example if you have added another address column you would like to use).
- You need to set the server address. Please copy the URL https://photon.komoot.io into the respective field. This is a publicly available service.
6
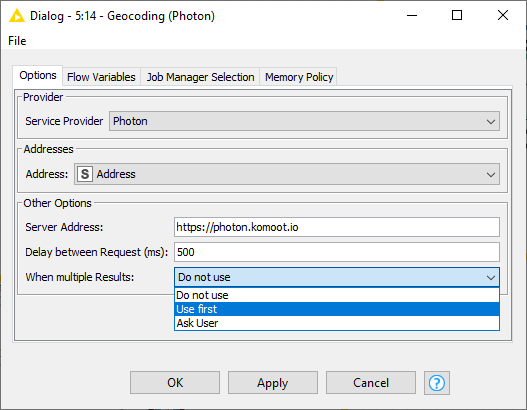
- For many requests geocoding services return multiple results, for example, if there are two streets with identical names. In the dropdown menu “When multiple Results” you can decide how to deal with this.
- “Do not use”: All multiple results will be discarded.
- “Use first”: The first entry of the multiple results list will be displayed for each address
- “Ask User”: All multiple results will be displayed. The user needs to go through all results and pick the favourite one menually. This is a lot of work for large data sets.
- In this tutorial select “Use first” and click “OK”.
7
- Right click on the Geocoding node and select “Execute”.

8
- The execution might take a while.
- The progress bar under the node shows the percentage of data which has been processed.

9
- When the execution is finished, we can look at the results.
- Right click on the Geocoding node and select “Coordinates”.

10
- In the dialog that pops up, you can look at the whole data table.
- Scroll to the right to look at the columns with latitude and longitude (the two rightmost columns).
- Sometimes the geocoding service cannot find longitude and latitude (see red circle).

11
- Drag a Tracing View node into the workflow and attach the output port of the geocoding node with the first input port of the Tracing View node. Connect the second and third output port of the Supply Chain Reader node with the second and third input port of the Tracing View node, respectively.
12
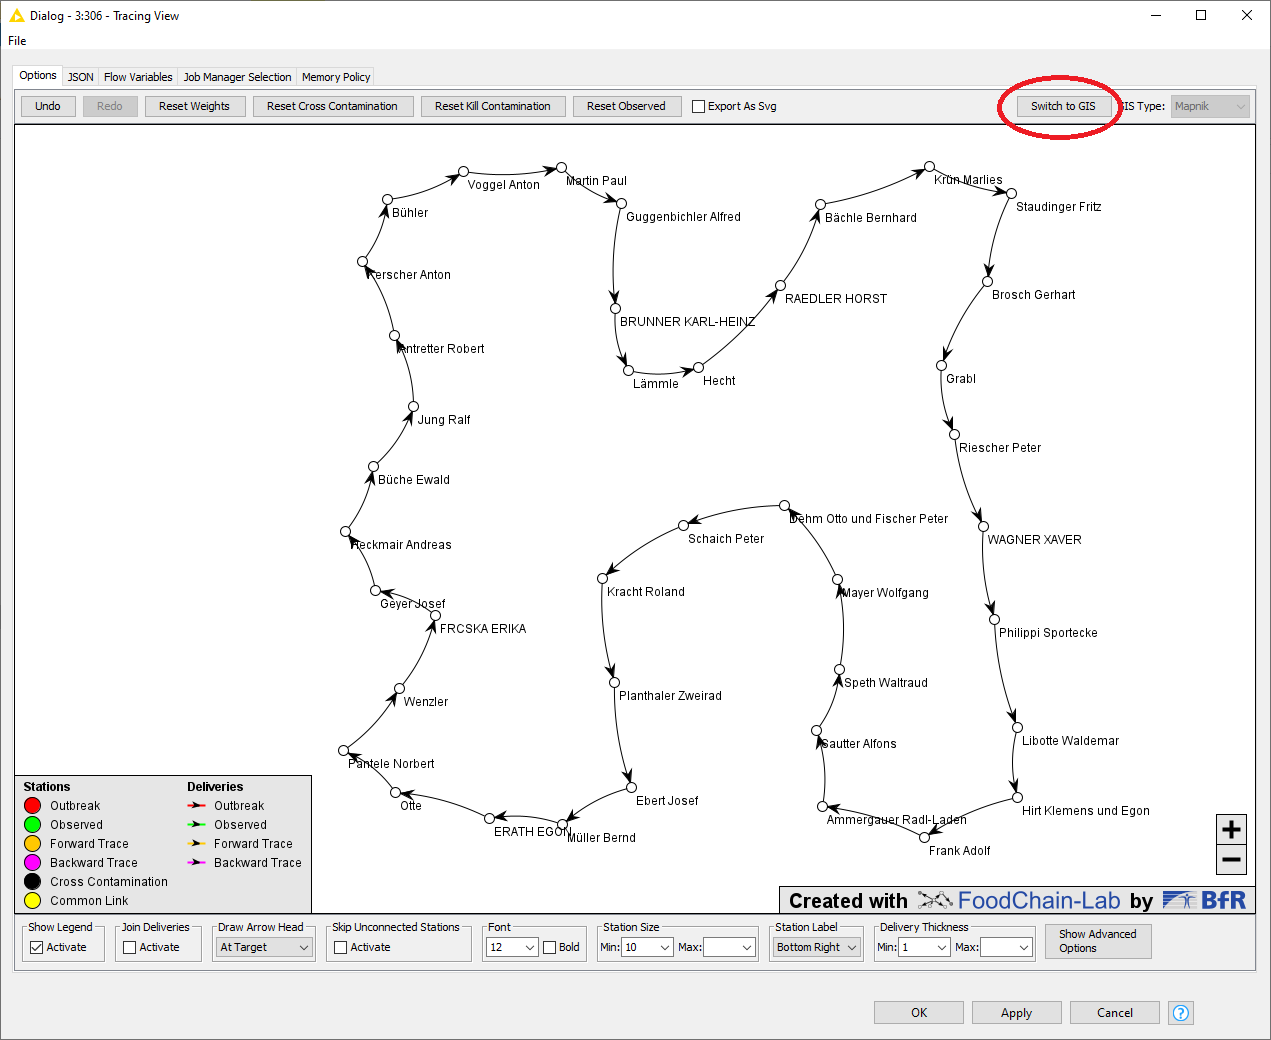
- Double-click on the Tracing View. You see the graph view showing the different stations and how they are connected.
- Klick on “Switch to GIS” in the top right to see the stations on a map (see red circle).
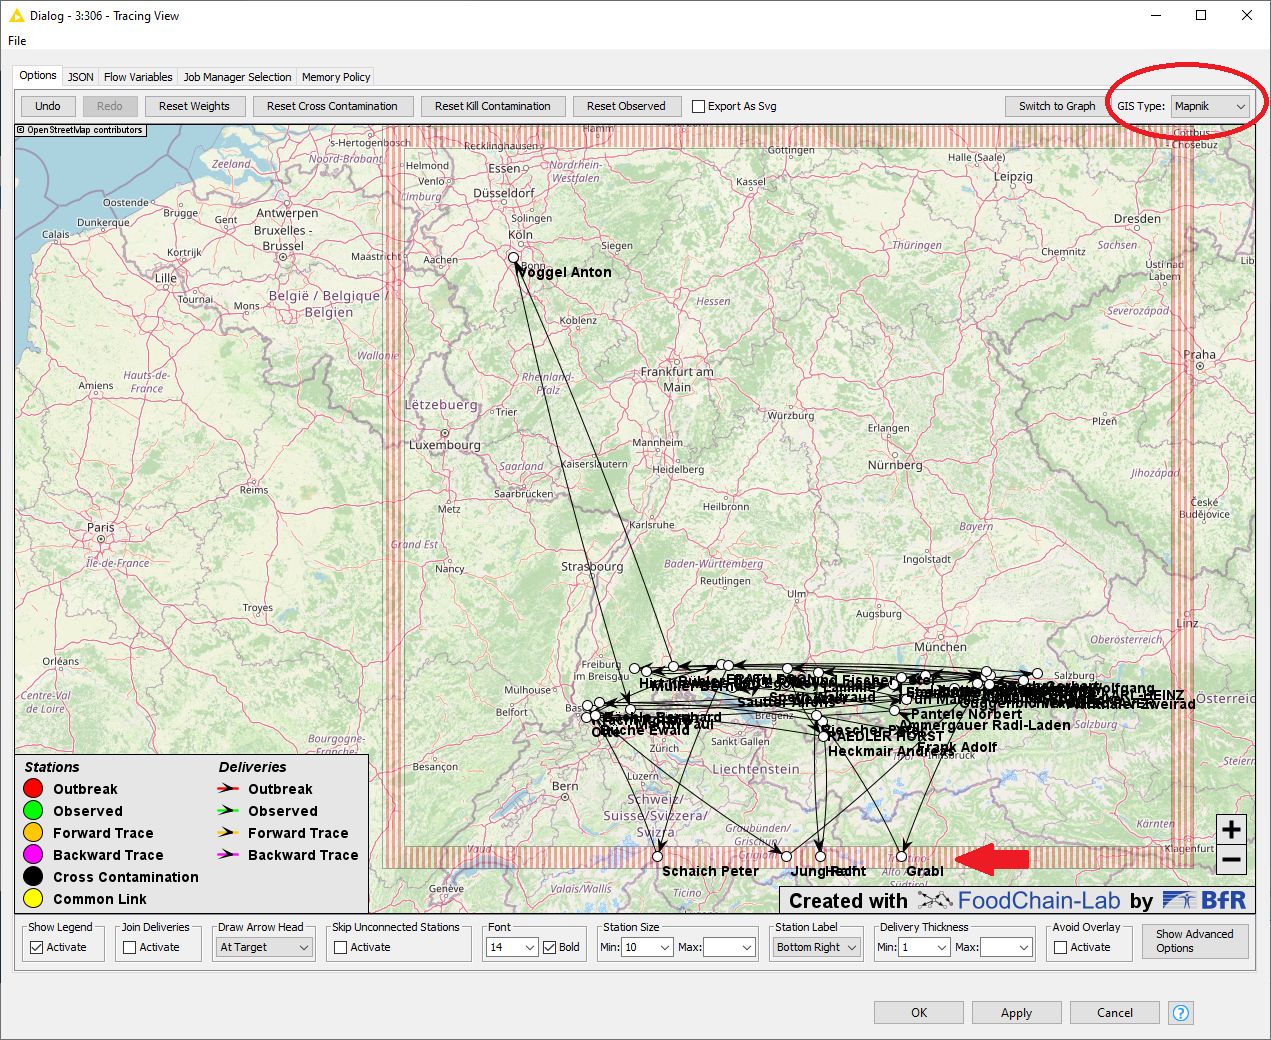
13
- In the map view the stations are shown at their actual positions in Southern Germany.
- Via the button in the top right corner you can choose between different map services (see red circle).
- Those stations for which no longitude and latitude could be found by the geocoding service Photon are shown on a frame to indicate that their position on the map is not the correct position (see red arrow).
- If you do not want to see the frame, you can position a Row Filter node between the Geocoding node and the Tracing View node. Filter in the column “Longitude”, select “Exclude rows by attribute value” and “only missing values match”. However, we would advise against excluding stations from the supply chain because this effects the trace negatively. Better search for the locations which could not be retrieved in the first search with another geocoding service, either with the Geocoding node or online.
14
- If you would like to add the missing coordinates, there are several ways to do so. One is the following:
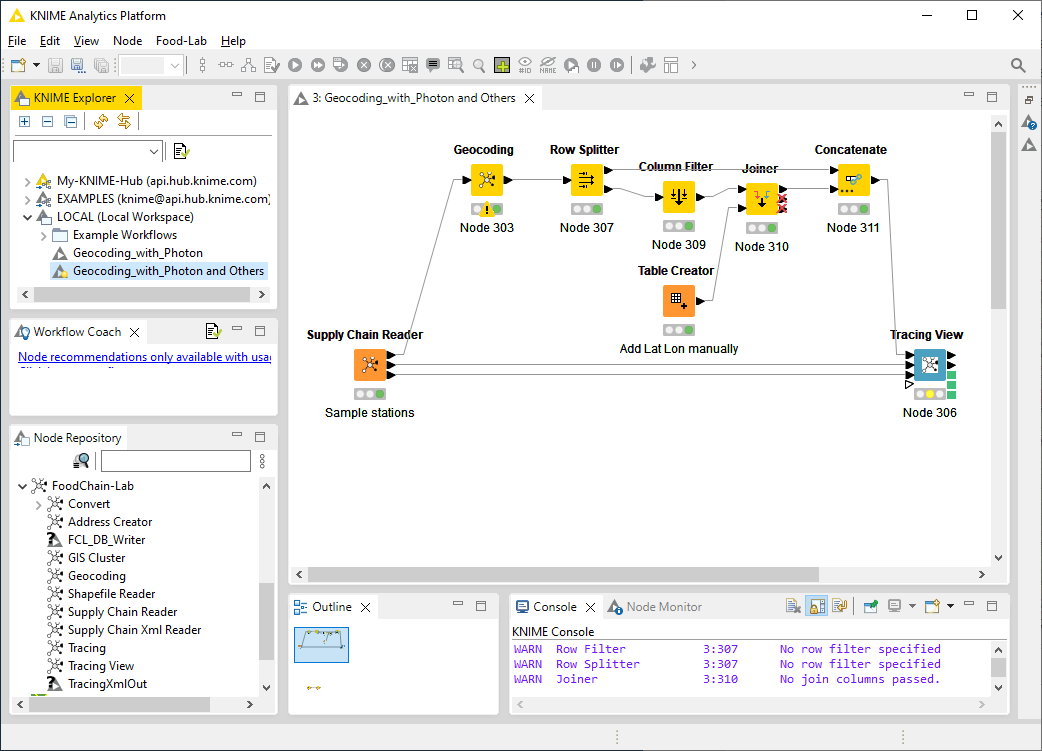
- Attach a Row Splitter node to the Geocoding node in order so separate the addresses without longitude and latitude from those where these were found. Filter in the column “Longitude”, select “Exclude rows by attribute value” and “only missing values match”. The addresses without coordinates will be in the lower output port.
- Attach a Column Filter node to the lower output port of the Row Splitter node and exclude the columns “Longitude” and “Latitude”. Execute the node, open the output port and copy the values in the column “Address”.
- Add a Table Creator node to the workflow and create three columns: “Address”, “Longitude” and “Latitude”. To name the column, double-click into the empty column header. The column names need to have exactly the same name as in the rest of the workflow. Select “Number (double)” as type for both longitude and latitude. Paste the copied addresses in the new column “Address”.
- Search with an online map service for the addresses one by one and copy longitudes and latitudes in the respective columns of the Table Creator node. Use a dot as decimal separator, not a comma.
- Attach a Joiner node and join by the column “Address”.
- Attach a Concatenate node to get the whole dataset in one output port.
- Connect the output port of the Concatenate node with the first input port of the Tracing View. Now, no frame should be visible and all addresses should be displayed on the map.