This manual gives an instruction how to use the model repository FSK-Web to search for a FSKX compliant models of interest and execute it online with creating an user-specific simulation setting. After model execution, an interactive dashboard will be created for the visualization of the model result.
1
After login to the FSK-Web Protected Area you will have access to the service for executing a FSKX compliant model from the model repository online with creation of an interactive dashboard to visualize the model result by using the workflow Model Execution with Dashboard.
Start the workflow by clicking on the Run button.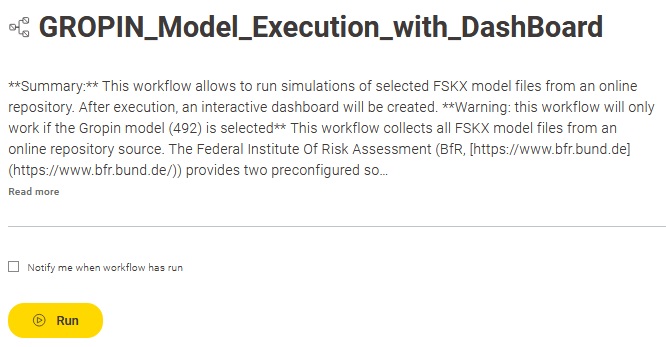
2
The workflow provides the main view of the FSK-Web model repository. This view shows a tabular collection of the available models. 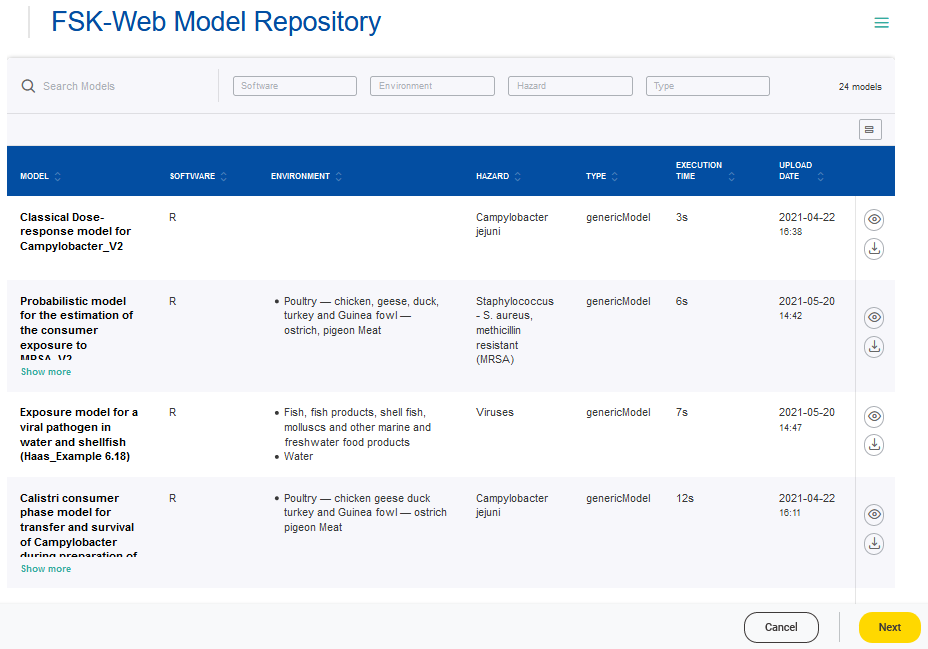
It includes search and filter functionalities for the main model metadata “Software”, “Environment”, “Hazards” and “Type”.
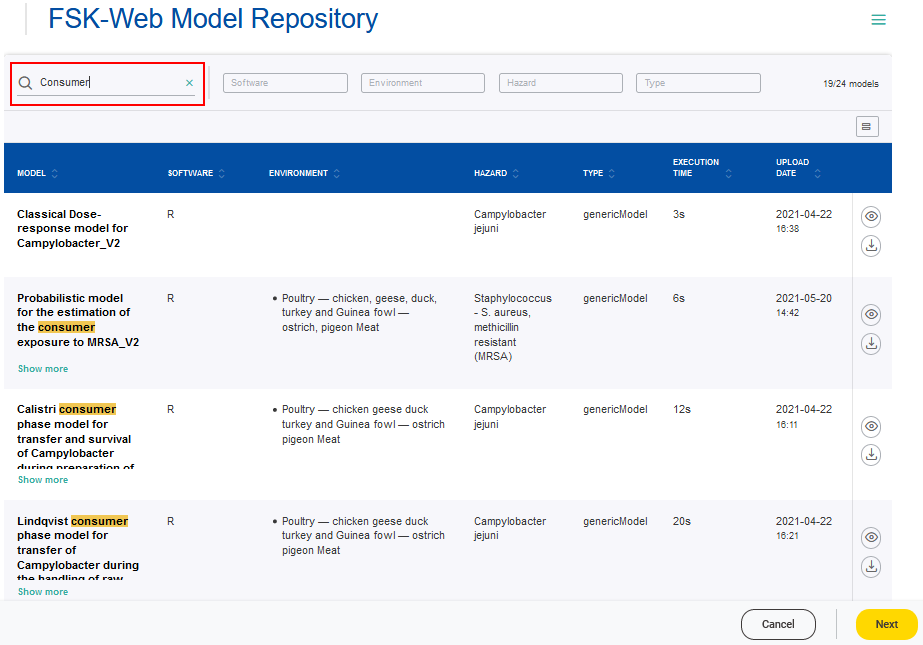
- Entering a keyword into the search box allows filtering over the model metadata
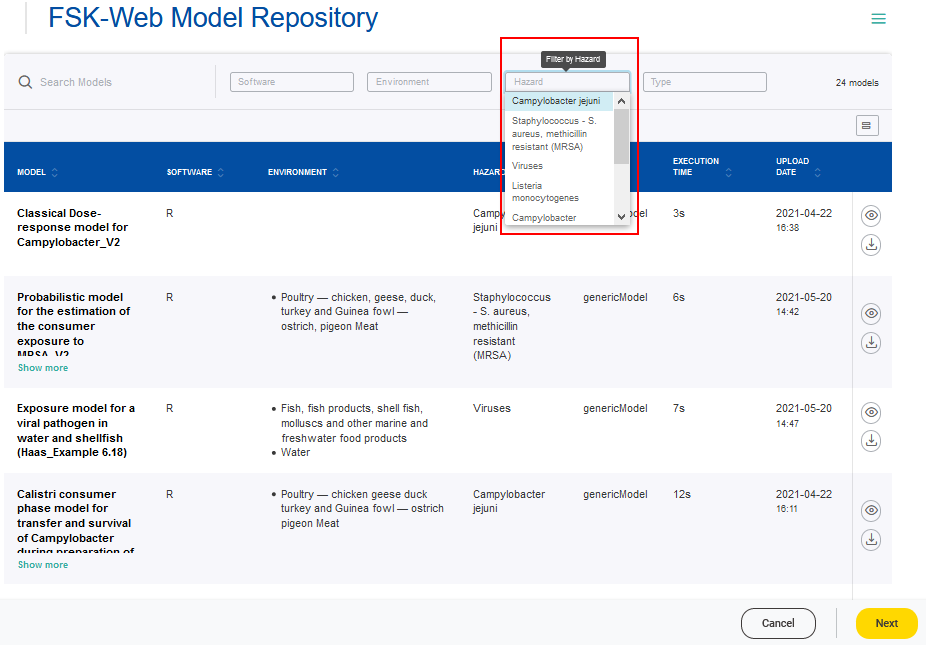
- Clicking on the filters will show the entries available for selection
The full model metadata can be accessed via the Details button. 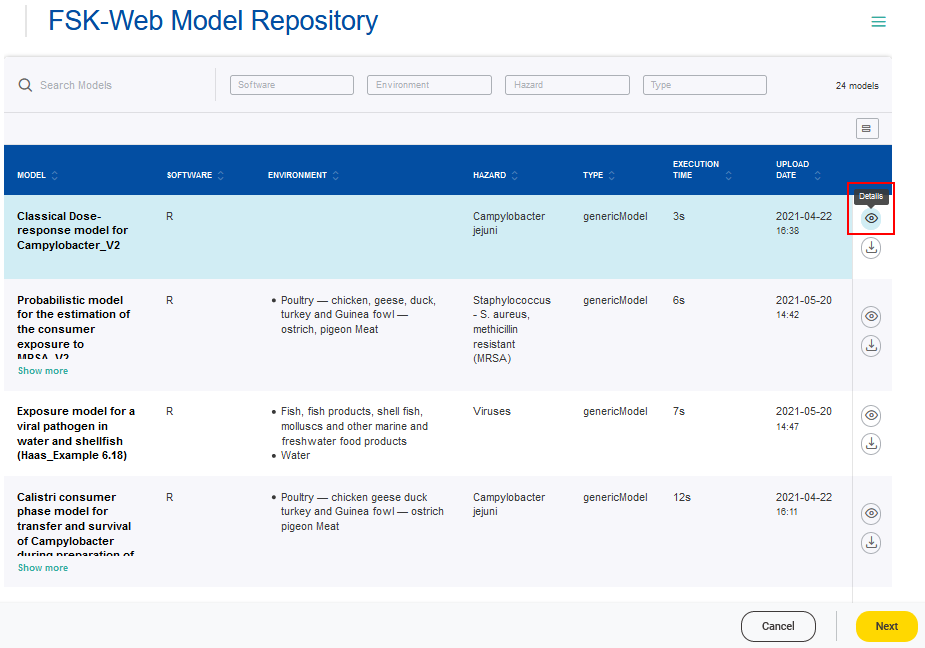
According to the FSKX specifications, the model metadata cover the four main categories “General information”, “Scope”, “Data background” and “Model math”. For each of these main categories the metadata are presented in a structured form via different tabs. Furthermore, a plot of the model result for the default simulation is provided as a preview. Also the code for the mathematical model and for the visualization of the model result is available for review.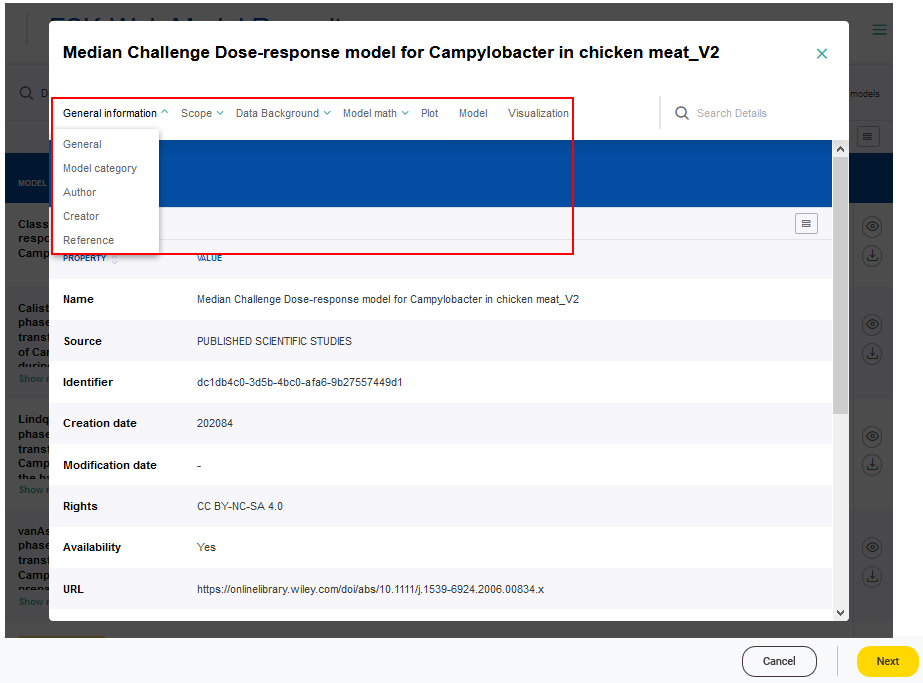
The FSKX file of a model can be downloaded via the Download button and saved to a local device.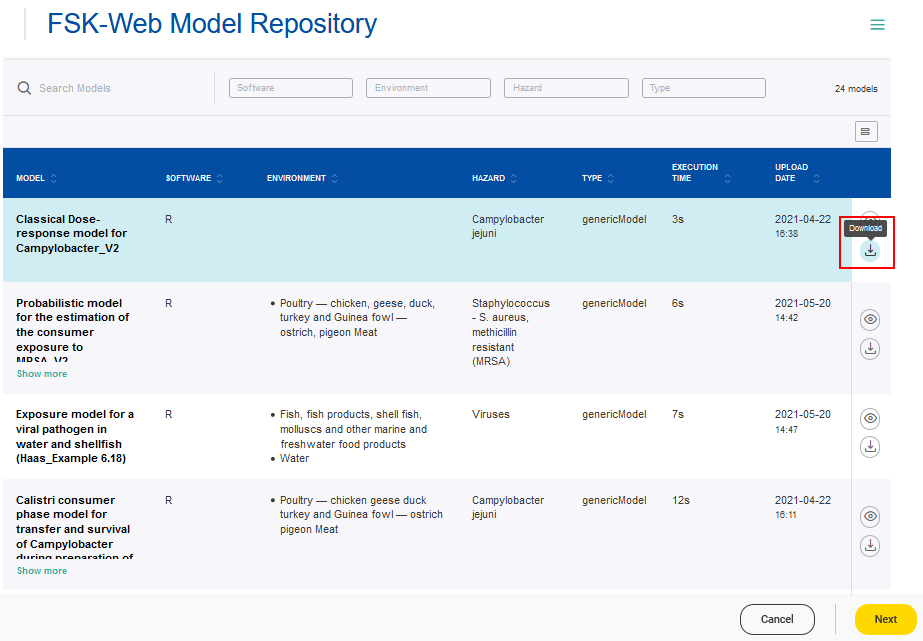
3
The workflow provides the functionality to execute a model online with creation of an interactive dashboard to visualize the model result. Therefore, a model of interest has to be selected from the table (checkmark) followed by clicking the Next button.
Warning: This workflow will only work so far for the Gropin models.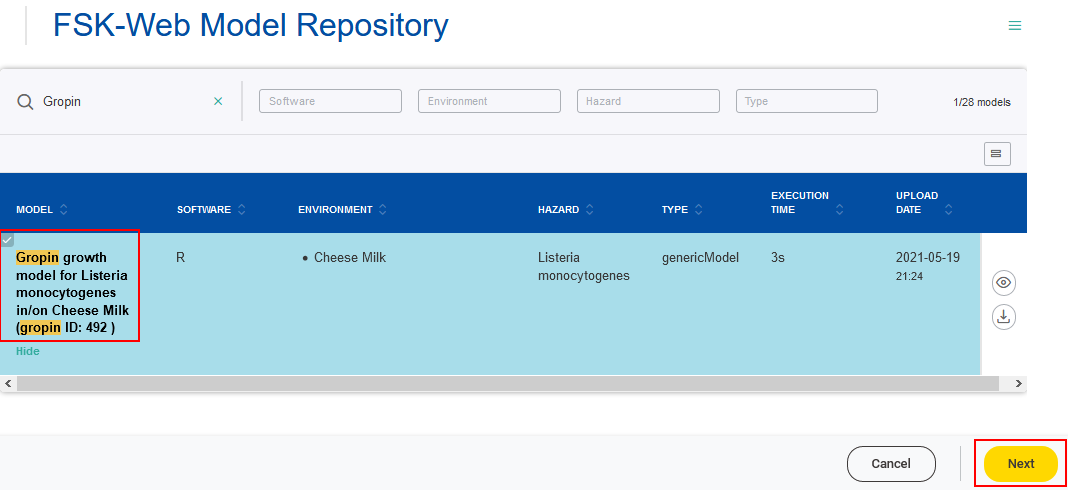
4
A FSKX compliant model allows to create and execute different simulation scenarios. Therefore, parameters are defined by the model creator. These parameters are used as variables within the model code. The parameters are classified as input or output parameter. Each input parameter has an initial value, provided by the model creator, to generate the default simulation. The values of the input parameters can be adjusted in order to create additional simulation scenarios.
The workflow allows to execute a model based on simulations with default or user-specific parameter values. The user can choose among the available simulations predefined by the model creator or create a new one by modifying the input parameters listed. To support the user in designing a new simulation, further information of every parameter is displayed when clicking on the corresponding i symbol.
All available predefined simulation can be accessed over the drop-down menu.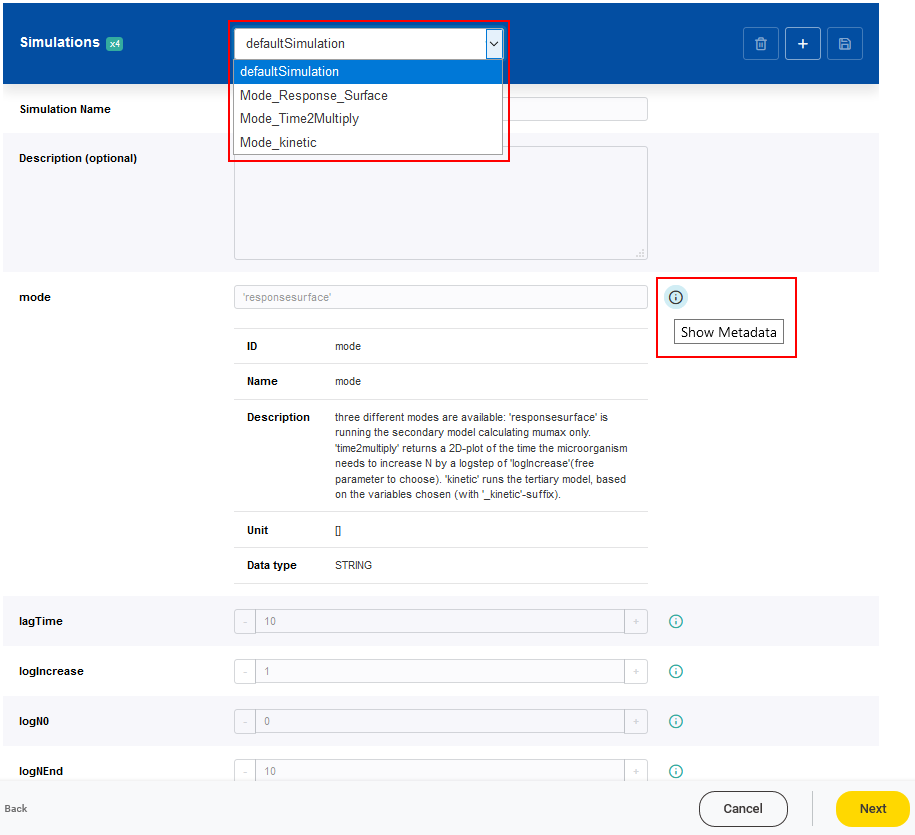
A new simulation setting can be added by clicking on the Add simulation button (plus symbol).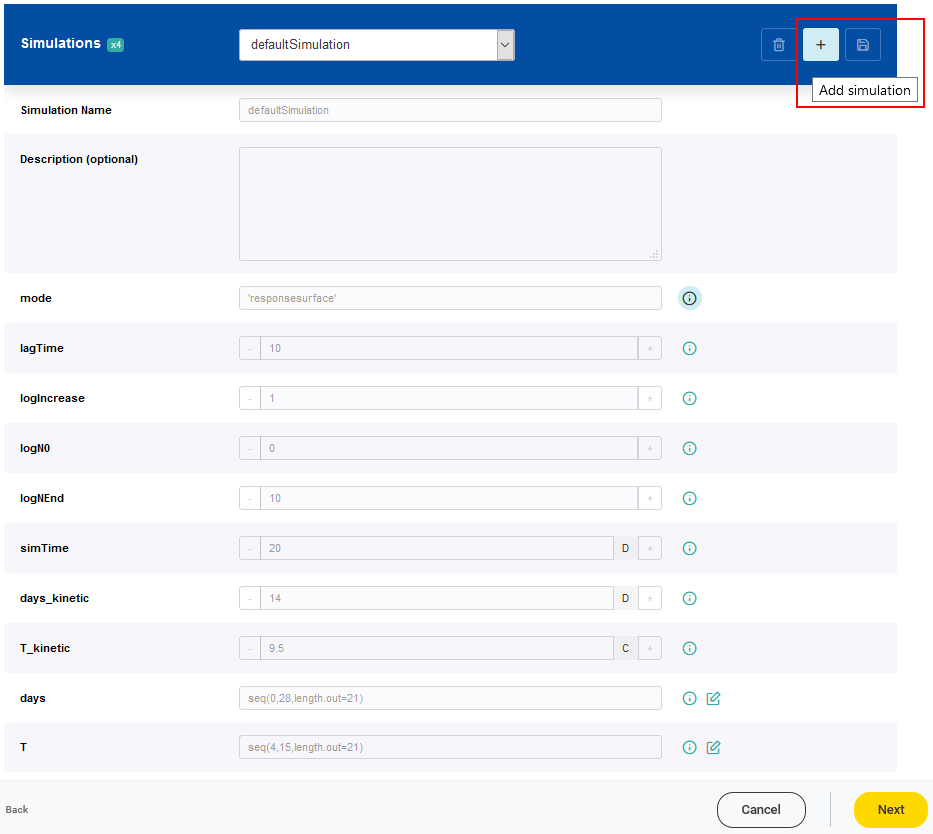
For each new simulation setting a name has to be given. The values of the parameters can be adjusted according to the scenario of interest. It is possible that a range of valid values is predefined for a parameter based on a minimum and a maximum value. Values of parameters which are classified as constant, cannot be modified.
The newly created simulation setting has to be saved by clicking on the Save changes button.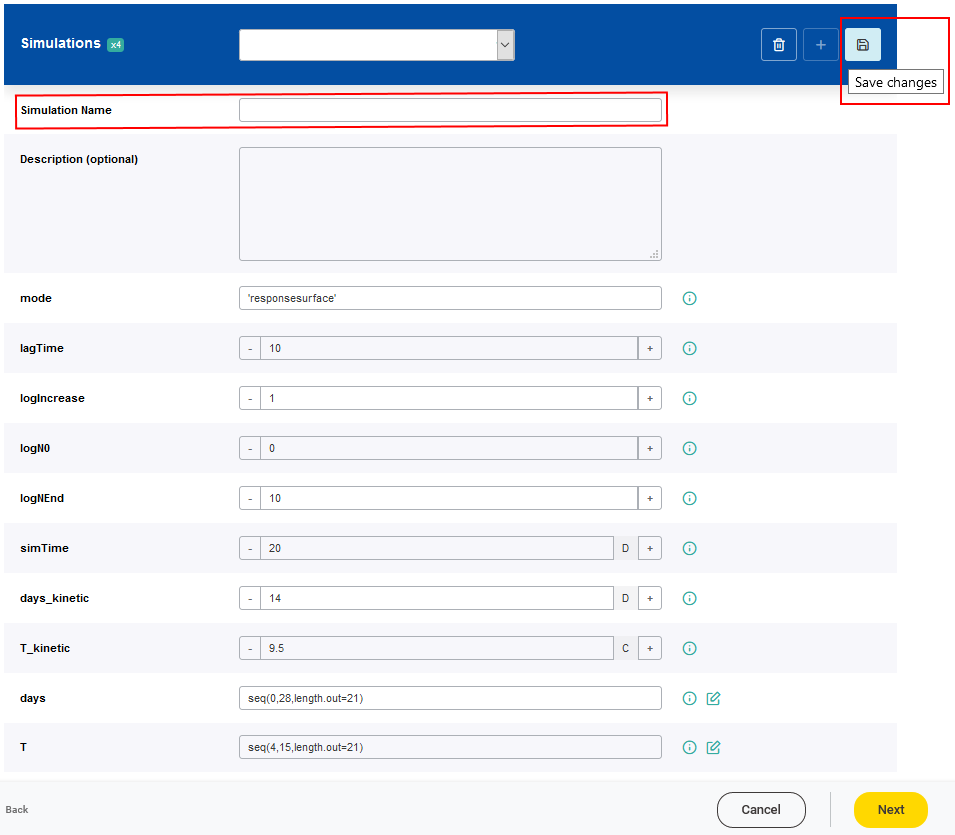
Once a simulation has been selected, the model can be executed by clicking on the Next button.
In this example the simulation “Mode_Response_Surface” will be selected.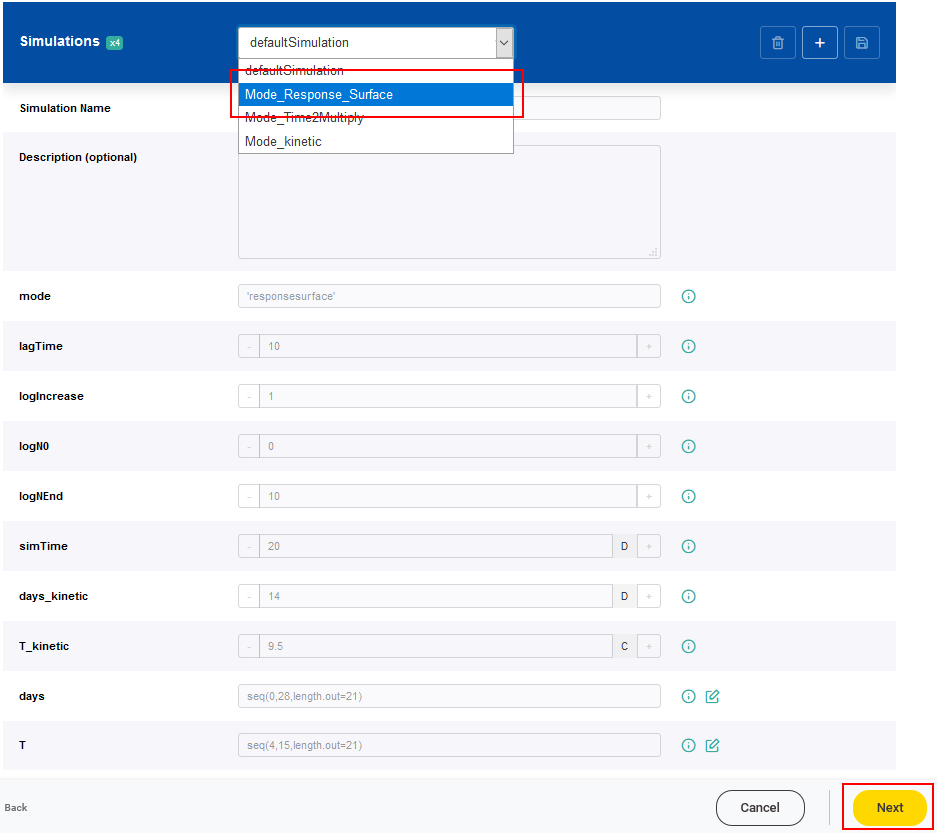
5
The workflow automatically generates a report showing the interactive dashboard to visualize the model result.
The embedded figures in the interactive dashboard are generated by the visualization script that the model creator provides together with the model code. They are showing a 3D and a 2D scatter plot of the model result. Furthermore, controllers are provided for the variables. The interactive dashboard also includes a summary table for the model result.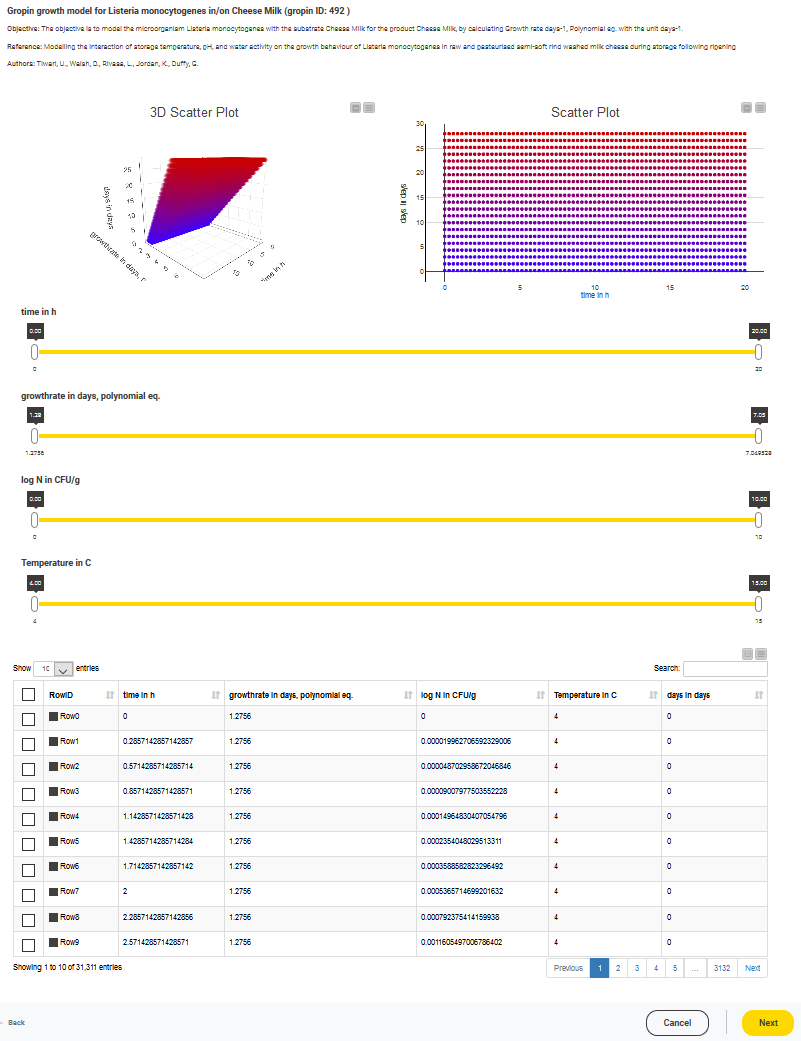
The controllers offer the opportunity for adjustment in order to select the calculated data for a specific range of the variables. This selected result will be shown in the scatter plots and in the table.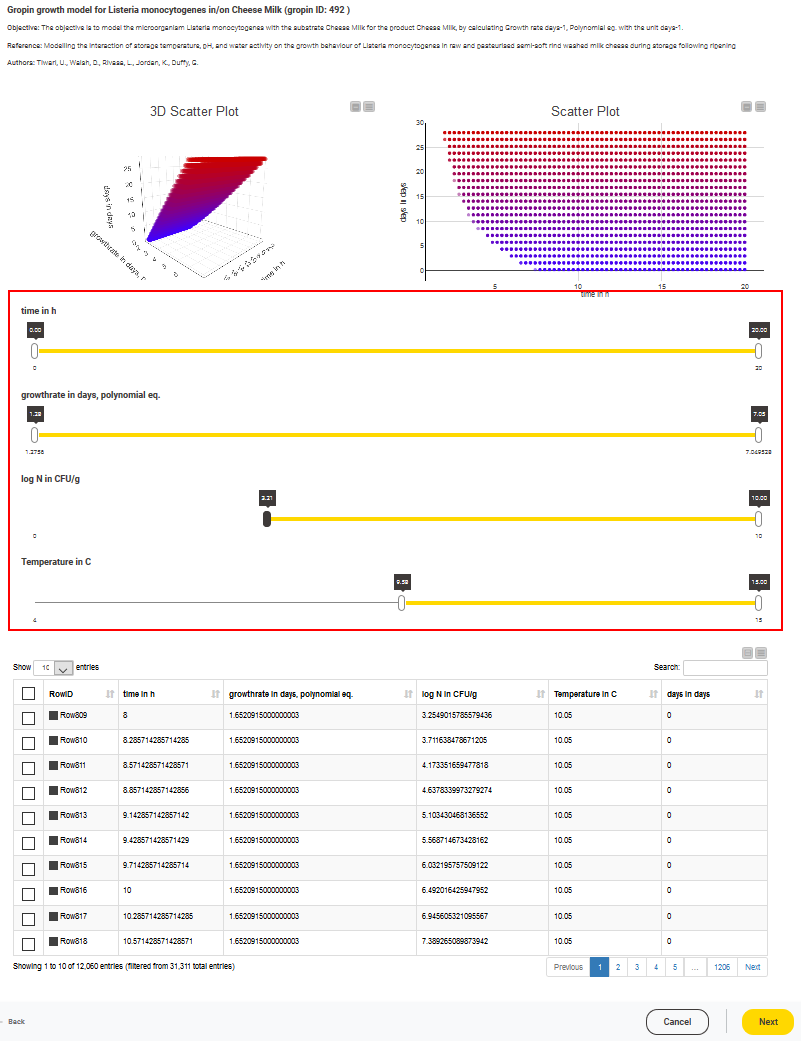
The scatter plots offer the opportunity for adjustment by changing the plot settings like the allocation of the variables to the axes. 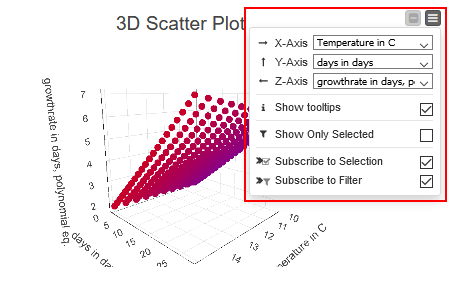
Furthermore, features to rotate the 3D scatter plot are provided.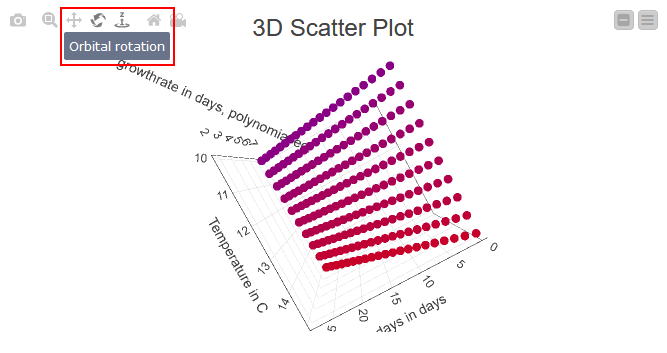 Both scatter plots can be downloaded.
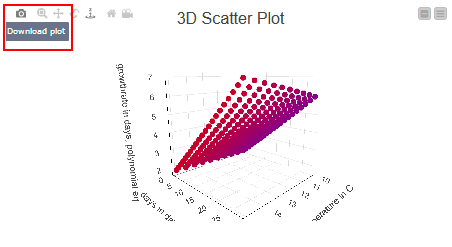
6
The workflow automatically generates a report showing the main settings and the results. The user can download the report (available in different formats .pdf, .docx, and .html) and the FSKX formatted models, either the model with the default simulation and the corresponding simulation results (original model) or the one created with the user-defined simulation settings and the corresponding simulation results (new model). The embedded figures are generated by the visualization script that the model creator provides together with the model code. All generated numerical simulation results are included into the downloadable FSKX files (inside the saved R workspace).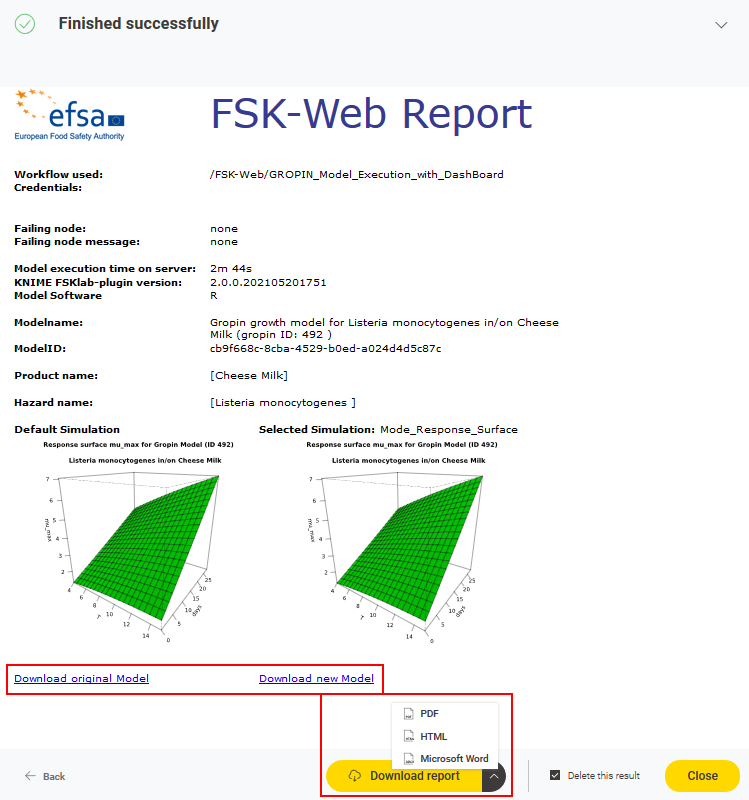
This manual was created with support from EU and EFSA funding (GP/EFSA/AMU/2016/01) by BfR. It only reflects the BfR researchers views. Neither EFSA, EU nor BfR is responsible for any use of the website or the service.EFSA is an agency of the European Union